

Power BI Goals: What are they and why should I use them?
The Power BI Goals feature was only recently announced in May 2021, but if you’re not already using them, you’re missing out. It’s essentially a KPI tracker built into the Power BI service, providing a central place for you to track KPIs and other measures from a variety of workspaces and reports. It’s available for those with a Premium licence, and this does include Premium-per-user (PPU), but with the caveat that you can only share your goals with other PPU users.
The Benefit of Using Goals
The benefit of using Goals instead of creating another Power BI report is that you don’t need to create a new master dataset spanning all of your previous reports. Instead, Goals uses your existing reports and datasets as its data source. Why not just use a Power BI dashboard? A dashboard can only source its data from reports within its own workspace, whereas Goals data can be sourced from any workspace (providing you have access to it). Furthermore, data brought into Goals is visualised identically for all KPIs—regardless of the formatting of the underlying report—allowing you to digest the information more easily.
Top Features in Goals
There are several features in Goals that you won’t find anywhere else in Power BI:
- Each goal is assigned an Owner, so you know which user (or a selection of users) is responsible for each KPI.
- Goals and their targets can be manually entered, as well as sourced live from data, which is a useful way of quickly bringing in values or targets which may not exist in the source data. It’s exciting to see users being able to input data into Power BI, albeit in this constrained manner.
- A Status may be assigned to each goal, which can be chosen from a selection of options, such as ‘On Track’, ‘Behind’ or ‘Not Started’. A history of these statuses is kept, so goal progress can be monitored.
- Notes may be added to goals at a specific point in time, providing more context for the KPI. We’ll get into the nuts and bolts of these a little later on.
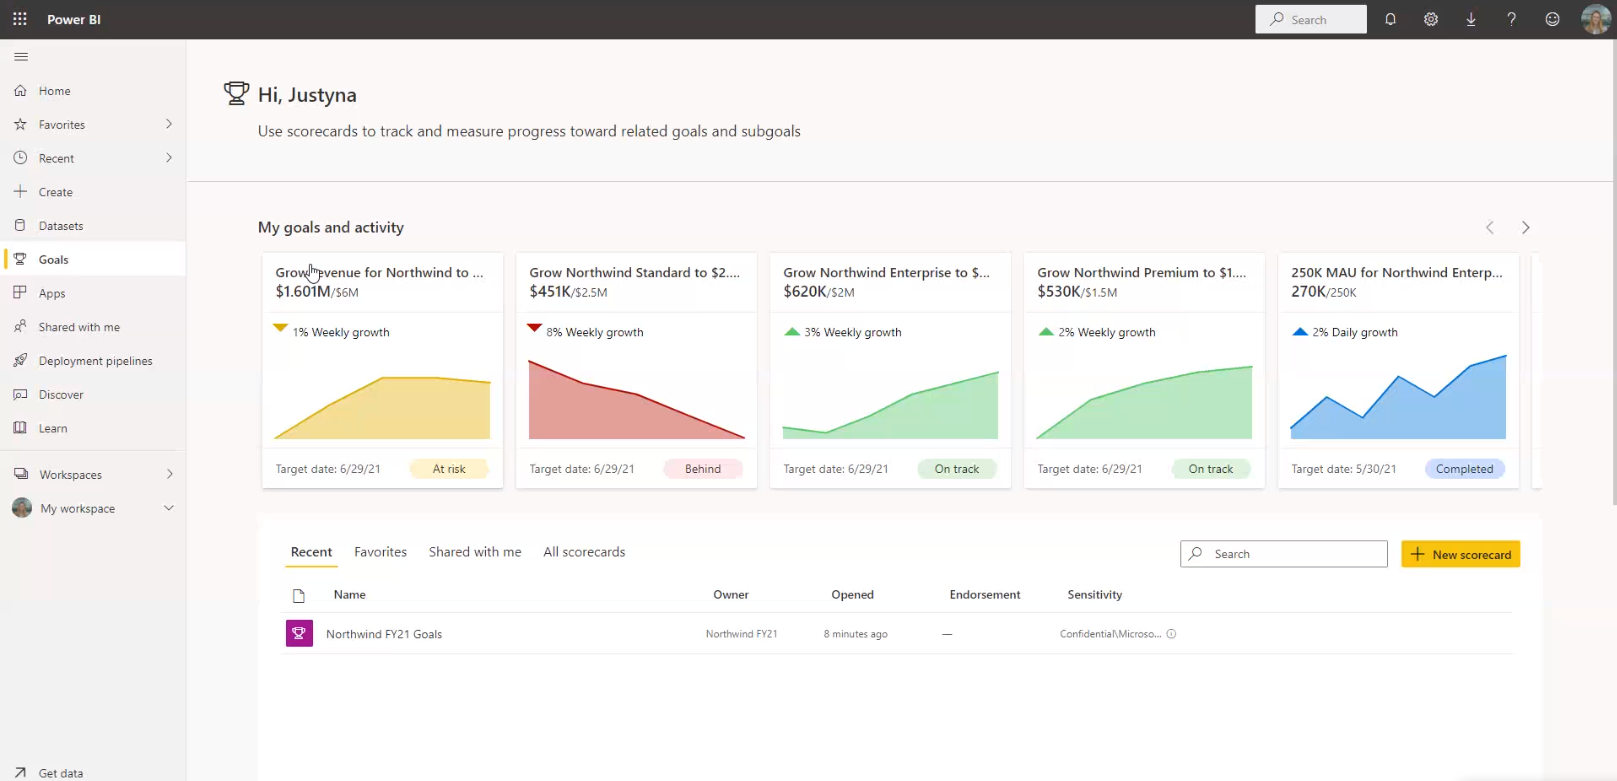
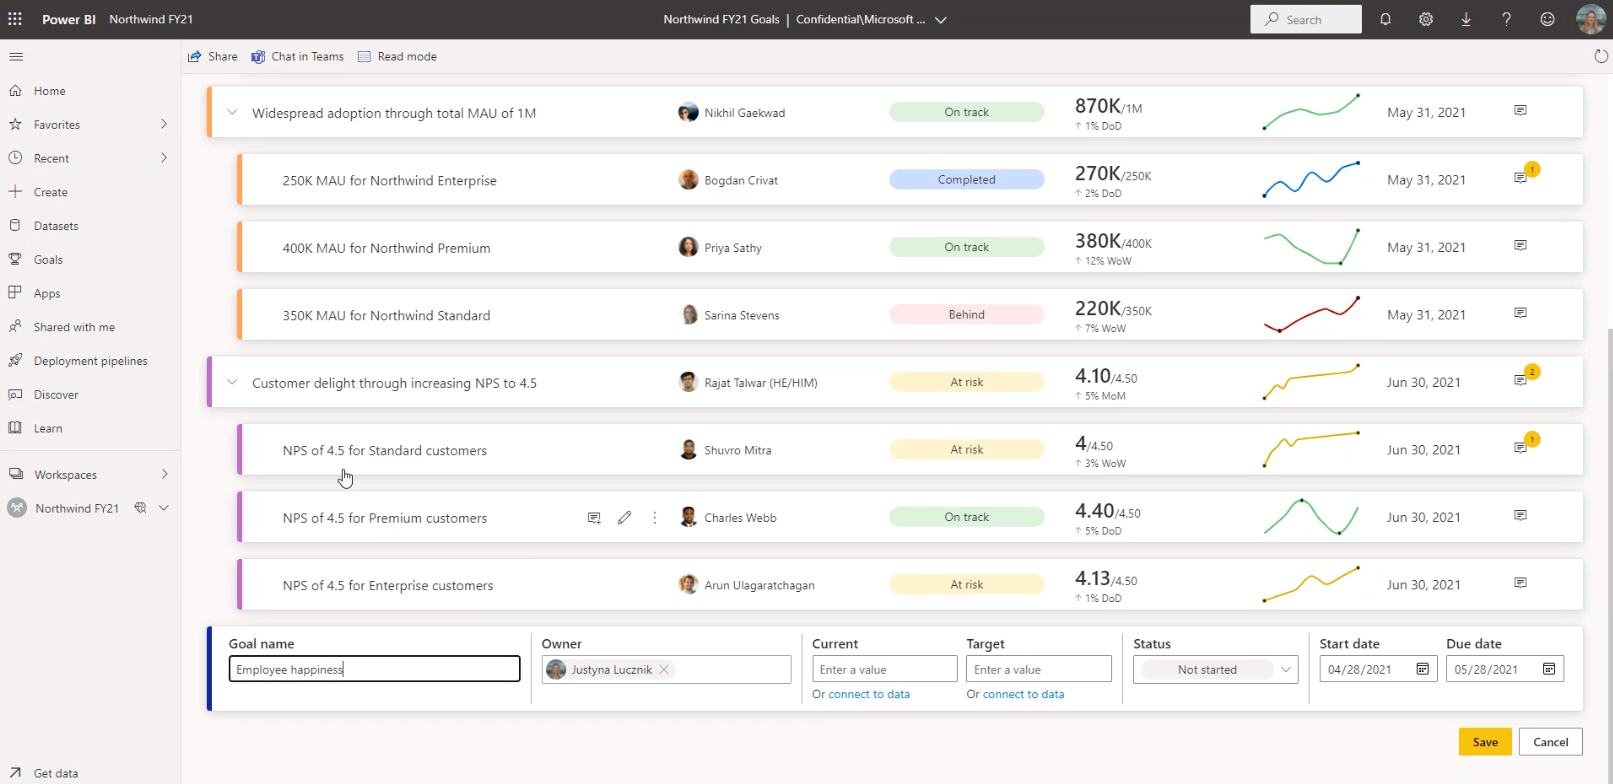
Goals
Each goal has a Name, an Owner (or Owners), a manually assigned Status, and a Value (which may be sourced from data or manually entered). A sparkline is provided in the Progress column, and a Due Date may be appointed if required. The Notes column allows the user to view historic statuses and any descriptive notes which have been added by users – we’ll talk about this a bit more later on.
Each goal is assigned a colour when it is created. The colour of the status and sparkline is determined by the value of the status, for example: a status of ‘Behind’ will cause both the status and sparkline to be red.
Goals may also have sub-goals, which can be collapsed under the parent goal, and inherit the same colour as the parent goal. You may also create sub-sub-goals, sub-sub-sub-goals, and sub-sub-sub-sub-goals. If you discover a limit to how many levels deep you can go, I’d be interested to know!
When creating a goal, historic data will be brought into the goal from the source data where it is available. Otherwise, Power BI will take a snapshot of the measure at specific user-defined intervals and store the value in its own dataset, so eventually historic data will be accrued. In my screenshot below, you can see most values had historic data which was imported, except the ‘Canada Sales’ goal. This sparkline will appear once historic data exists.
Notes and Check-ins
In the Notes for a goal, you will find a detailed list of the previous values and statuses for that goal. Check-ins allow you to assign a new status to the goal. If the goal value is not derived from report data, this is also where you would update the value manually. During a check-in, you have the option to include a note to add some descriptive context to the data.
In the History tab, you can see all the previous values and statuses for a goal. When checking-in, you can back-date the check-in to associate it with a particular data point in the past. This is extremely helpful in adding historic statuses if you can bring in historic data.
Power BI Goals is revolutionary in terms of tracking KPIs, bringing data from multiple data sources into one comprehensive view. It allows you to keep track of multiple goals in one screen, so you can work more efficiently and prioritise accordingly.
Here at Simpson Associates, we have a wealth of expertise around Power BI – if you need a helping hand getting started or want to further your knowledge, please feel free to speak to us using our live chat, where one of our experts will be happy to speak with you in more detail.
Blog Author
Dr Ash Ward, Senior Consultant, Simpson Associates
Don’t forget to join us on LinkedIn


- Share
